How granular is your SLO?
Sam Jewell, Staff Software Engineer at Grafana Labs, speaks about a real security incident - triggered by a vulnerable GitHub Action, detected with Canary Tokens, and handled with speed and transparency.
 Sam Jewell, Staff Software Engineer, Grafana Labs
The transcript below has been generated using AI and may not fully match the audio.
Great. Thank you. Yes, I'm Sam. nice to meet you all. Thanks for having me. I thought I'd tell you a couple of things about me to begin with. I live in North London and I enjoy cycling. I was able to cycle here, which is a real treat. I thought I'd record my route on Strava and show it to you 'cause I decided I'd trace out a nice, route and make a Strava map.here it is. I did tell the ai, no, you have to follow the roads. I'm not gonna be able to ride through those buildings. it might be more wiggly. It said. Of course. You're right. Let me try again. So, there you go. Yeah. My talk today is about SLOs. We heard a lot earlier at the keynote about how AI are gonna be writing a lot more code.There'll be more code per engineer, and there are gonna be more incidents. We're gonna have less. Context over the code that we're looking at more, incidents. what's, immediately upstream of the incidents is alerts. We'll probably see a lot more alerts. And how might we try to keep control of those s alerts and, try and make them better quality, fewer, better quality alerts.SLOs is a fantastic tool for that. That's why I'm here talking about SLOs today. SLOs is a pretty big topic, not something I could cover in 20 minutes, and there's plenty of material out there already. I'm gonna pick off a small piece, which is multidimensional SLOs. so some of this content might be a bit new, I'm hoping.To get there. I'm gonna hang this, hang my examples of a real concrete service that I was helping us run Agri Funnel Labs and what our SLOs were gonna talk about. Just a little bit of foundation, what our SLOs, bring some of you along if you don't have that foundation knowledge. And then when we get to the multidimensional SLAs, which is the bulk of the talk, I'll talk about a lot of toil and an incident that I faced at work.then the history and the lead up to that, week at work where we were adding dimensions and reaping some benefits. And then after that we did some cleanup and consolidated simplified. So that's what I'm gonna cover. and our goal with this is to just get more uptime, more reliability, and to reduce, alert fatigue, reduce that operational burden and the toil.So we'll see if we get there. We'll see if we deliver. I work at Grafana. Our flagship project is Grafana itself. This is Graf, it's where you might build dashboards, visualize all your observability signals in one place. So that could mean putting your logs right next to your metrics, zooming in on a spike in your metrics, seeing the logs at that instant.It might also be where your AI agent, if you're using, an AI agent like the demo earlier today, that agent is querying Grafana, getting the telemetry from Grafana, and also looking at all those dashboards. now people use all kinds of different providers for metrics, for logs, for traces, and for their SQL data sources as well.Grafana is more powerful if we support a lot of different data sources. The first thing you do when you query is pick a data source. And so in the UI that's here, this, was my, team, this is what I was working on. So we're here in the ui. This is the piece I we're talking about.We, I was in a department where we had four squads, 50 different data sources. these four squads, we had some shared code and a shared on-call rotation. And this is the service that we were running. Our client was gr refine itself, the UI and the alert manager. And then we would call out to the customer's backend, the metrics backend, the logs, backend, whatever it might be.And this was a multi-tenant service. So we'd, have different Grafana tenants calling to us and reaching out to different customer backends. And then we drew our boundary for our SLO and our service. Here we, we consider our client as the Grafana instance, calling out to us. So it wasn't a, we don't, we didn't choose to have a customer facing SLA.the reason we did that was it would allowed us to isolate and measure our own performance, and we could see, what our effects were on, on, on the system. when we made an improvement, we could see it immediately, basically.The other thing that will help you understand the story later is to know that when we are measuring SLOs in Grafana Labs, we use, we count requests. We're not counting minutes or hours, we're actually counting requests. And so we count the number of successes on the top of the fraction and the number of total number of requests on the bottom of the fraction, and we're trying to keep that above 99.5%.So hopefully that context will help you understand the rest of the story. and we also have an SLO product, Don Grafana Cloud. I encourage you to, lots of people will pull Grafana, open source, host it themselves, and even our metrics and logs backends, we have Mi mere lowkey tempo. People will run those in house themselves as well. More and more we have. Some amazing, solutions on Grafana Cloud.Only accessible there. One of those is our SLO product. and of course we dog feed this. We use it internally to track our rain SLOs. And so this is a report. We, all the engineers in the whole company, that's 500 engineers receive every week. You can see top left, 611. That's the number of different SLOs that we now track across all of our teams.this has worked really well for Grafana Labs. Our CTO says it has been so transformational for the culture of how we measure our performance at Grafana Labs. And like, why is that? It's basically, 'cause, as we put our attention to the SLOs, we can switch off all these other alerts that are looking at, all kinds of different things.we roll up all of our alerting into SLOs and alert on those.So receiving this report in our inbox every Monday, it helps, keeps us accountable. And so we do look after our own SLOs. We, try pretty hard to keep them green. but another thing that happens is if our SLOs too high, too close to 100%, the CTO will come to us and we'll say, that's too good.You're not taking enough risks here. don't, invest so much in reliability. Be more innovative. so that's pretty cool. Pretty interesting. All right, but what are these SLOs? So quickly dive in. So that book on the right site, reliability Engineering, the SRA book from Google, that's our kind of, that's, our reference that we give to new, joiners joining the company.so I'd highly recommend that, there are these terms. S-L-A-S-L-I-S-L-A. So SLA, that's the agreement, service level agreement. That's what is in your contract. If you breach that you might give credits for the month, that kind of thing. The SLI, that's your indicator, that's the where you're at versus where you want to be.The current performance. And then the SLO, that's the objective. That's where you're trying to get to. It's your target. It's an internal target that you don't publish to your customers necessarily. And it's a product decision. and that is, that might change over time. You might choose to change it, again, as a product decision.And this is a, it's a compromise between what your customers can, tolerate, and what they're happy with, and what you can tolerate internally in terms of how much you're willing to spend and how much you can invest in reliability. So it might be higher than your SLA, you might be more ambitious internally than what you commit to in your SLA with your customers.and this is my own high level summary of these SLOs. It's not, just this, acronym service level objective, but it's become this kind of, this practice that's evolved and, all of these, techniques around how to manage this and how to reap the benefits. You start from, a hundred percent uptime is completely unachievable, but also it's not at all cost effective.And we're trying to get good value for money. we want value for money, so we're gonna pick a realistic target, such as, in our case, 99.5%. And then what we're gonna do is track performance versus that target. We're not gonna track performance over 5, 10, 15 minutes as maybe the alerts that. the SLOs have replaced, might have been doing.But instead we're tracking performance on a monthly basis. We're gonna use an error budget and we are going to, see how much of that budget remains at any point in the month. And we're gonna track, that's the, downtime that we're allowed each month. And we're gonna, we're gonna.Use it. if we have some downtime allowance, why not use it? And then, but if you burn through the whole of your error budget, the idea, at least in the SRE book, is that you then switch the team from your innovation and feature work onto reliability work until you are back inside your SLA basically.So then building on that, how do you alert on these SLOs? the practice that we see as the industry kind of standard now is this multi window, multi burn rate alerting. this is, one of the references we use. And just the idea here is, if you're burning through your, error budget super, super fast and you're gonna blow it all in minutes or hours, then you need to page someone.So that would, then kick off a paging alert. Otherwise, if you are burning very slowly, you can just, raise a ticket, a warning alert, and someone can, tackle that when they're at their desk, when they, come to work in the morning. And so going forwards for the rest of these slides, I'm just gonna use red to, to indicate these paging alerts.And orange just to illustrate ticket alerts. And this is, I'm gonna show some illustrations and, it's to tell the story.Okay. So this back coming back to me and my own experience with that product, data sources that I was working on, I'd actually switched teams into this department and it was my second time, on call with them. And it was not really fun. Alerts are firing loads of alerts. These warning alerts are coming in faster than I can resolve them.it's like Tuesday, Wednesday. There's, I've, not closed any of these alerts and I, there's already a second or third one appearing and I'm investigating the new one that's just come in and I can see that the, one of our apps is. Crashing. It's crashing intermittently. I can see that it's, not consistently responding with errors, but it is dropping some requests and sending some errors back to customers.A fraction. and I think, okay, that's not great. Our guidance is pretty clear internally. It's if, there's an, if there's might be customer impact, then go ahead and raise an incident. So I do that. I raise an incident and. I'm about to update the status page, and a colleague of mine who's on now on the incident call says to me, this is not big enough for the status page.And I'm like, oh, wow. Okay. So I, we, have a bit of an argument now. It's like I, I am saying to him, this is affecting customers. Surely we can put it up on the status page. We also have guidance around this. It's if we know something's wrong, why not put it, on a stage page straight away?Customers would much rather come and see. He did have a point, and that's what this talk is about. but anyway, coming back to this goal, I def we definitely weren't delivering yet upon less alert fatigue and less toil. And, we weren't, one of the things you're supposed to get with SLOs is alignment in, the team and across teams.We were not getting that either. And so like, how could that be? SLOs are a super powerful tool, and yet if you use them in the wrong way. You're not gonna get those benefits. Okay. So,let me talk about dimensional SLOs. So we, like maybe winding back the clock a few years we were running in, we, might have had one SLO that was a roll up SLO for the whole of our service. And, that's green and everyone's happy. We're laughing all the way to the bank. not so fast.Unfortunately, we then start to roll our project to different regions. We are actually rolling it to different cloud providers, this is Grafana Cloud and running it in different, countries. And suddenly we're in a situation where a couple of our regions might be. Basically perfect.And another of the regions might be really suffering and we wouldn't be able to see it from that top level. So we, we don't wanna let one of those regions turn orange wheel and stay there because it won't be competitive. and we'll lose customers, so it's in our interests to keep every single region good.so every region is competitive, right? So what we do is we introduce a dimension to the SLA. I've said region. So in, in our case it was cluster. in any of your cases you could call it region or country, whatever you like. and we gained that benefit. we were able to then bring all of our regions, To parity, hit the objective. but we gained other benefits as well. So when we were then rolling out a new code and we'd roll it out, not everywhere at once, we'd roll it out cluster by cluster, and as soon as it hit that first cluster, we might see that the SLO would drop and it would allow us to stop propagating errors all through the system.So that was another benefit we gained. And then a third benefit of this approach is that, if you're top level. Goes outta SSLA, you can drill in very quickly and see where the cause of the issue is coming from. So this was a win. This was, we, made these changes and we benefited.This was a, real win. in practice, your origins won't be all the same size, and the smaller ones couldn't be even worse. if, you don't have that dimension on your SLA, the smaller ones can be really, bad, but they'll be hidden. Because they're so small that they don't affect the top, the top number enough to be spotted basically.And so our, SLOs are running in Prometheus, so we, just add the region label there in order to get, this granularity on the SLO. So far so good. But I told you that, I worked in this data sources team and we're running these 50 data sources now. I've written by product here. In our case, this was data sources.It could be endpoint that you own. It could be like customer segments or plan, customer plans, whatever it might be. But the truth is, you care about other dimensions to the service that you're running. And so we wanted to keep all of those different data sources performing well. We didn't want to abandon Jira and abandon GitHub and find that like suddenly our customers were all using someone else's product.So, that's what we did. We add another dimension and so suddenly we are watching this SLO, which has two dimensions now, region and product. And it breaks down like this. And again, we reap benefits and this is like a, we, there was an issue with one of our data sources, Mongo. We, as soon as we introduced this at him.Product dimension to our SLO. We spotted this issue with Mongo and we were able to fix it, and that issue had been hiding for months, if not years, honestly. So this was, this was beneficial and they, that's the extra label coming into the SLO. But can you see a potential problem with this?We've gone from one thing on the left to 12 things on the right, and we haven't actually changed our objective. The objective itself, 99.5, that has stayed the same. Now the cardinality here, the count of boxes, the number of grains can blow up pretty fast. So we had 50 plugins, 50 data sources. Like I told you, we actually had 25 clusters around the world, across these different, countries, different cloud providers, and suddenly the total cardinality was over a thousand.And we're trying to keep a thousand things inside SLO, without changing the SLO that we're actually aiming for. So suddenly, this wasn't even the day that I was on call. I just picked a random day and I, pointed this dashboard at a random day. You can see three paging and six warning alerts. So this was like broken for us at this point.It was not working. The toil was too great, and specifically like you can see, the whole service is green. Everything looks healthy. In terms of the number of pixels, right? The general trend here is everything is green. There's a few orange patches. The red patches are tiny, And so you ask yourself, okay, we did on some level we care.On some level we care, but we've got to prioritize. We've gotta invest our attention and our resources sensibly. That's what SLOs are all about. It's about, beep. Be wise with where we're spending money. and we concluded that those red regions are just too small, at least for this stage in the project and for where we were that, that period of the product development, they're just too small.We needed to, and we didn't even have this visual. we didn't even, unfortunately, it's easy to see that now, right? It's easy to see when I show it to you in this visual that they are tiny, but we didn't even have that. All we had was a stream of alerts. they all looked equally big. So that was painful, for us when we were on call.'cause you couldn't make that decision in the heat of the moment. Let's forget about this one. So how can you fix this? There's a few different ways. Amazon for S3, they take one approach. They have this four nines, 99.99 for the roll up, the top level. SLO but for like small zones within that, they use a much looser target of 99.5.So that's one thing you could do. It does add a bit of complexity. Suddenly you are like managing different targets for different, levels of your, SLO. Another thing you could do is to reduce the cardinality. You could just move from this one, SLO that had two dimensions to having two separate SLOs each that have one dimension.So you've got one with the region dimension, for example, one with the product dimension and like the cardinality massively drops. So on the left we've got 12 boxes on the screen, on the right, seven. and in, but in our real case, it went from a thousand down to less than a hundred. So it's an order of magnitude less.Far, far more, manageable. this is what I pitched to the team internally. another thing you could do probably is group together all those tiny little boxes, group them together into bigger boxes. so here on the right we've got one region, America and then other regions, and we've got one product A and then other products grouped together.And again, you can see the cardinality drops and it becomes more manageable. But again, like. This one adds some complexity too, because you're going from one SLO to two. This one adds a bit of complexity as well. This one, you're having to choose like which of the label values, which of the, items are gonna be grouped together and which are not, and those things need to be maintained.another solution might be one where you, instead of adding complexity, you're like simplifying and removing complexity. You just throw out one of the dimensions. So here. On the right, we've just got the product dimension. We've actually just thrown away the, the region dimensions. so this is removing complexity and with it like hopefully reducing that toil and reducing that kind of constant interruption, allowing ourselves to invest more, prioritize better, our reliability work, but we lose some of the benefits we lose, we now lose, that view of the, regions.But this was, this was what we went for. We were removed our, it was, it fitted our priorities. we needed to simplify. and, that was the more important thing for us at that moment in time. And the SRE book says, keep it simple. Have as few SLOs as possible and perfection can wait.and so at the exact same, when we remove the dimension on the same day, at the same time, we get down to just one warning alert. That was something we could, move forwards with, so we think we're, we are there now, we've got more uptime and less burden, less alert fatigue. Thank goodness.So this is an interesting question, was my colleague Wright, he had actually asked on the day, should this even have been an incident? The truth is, we. We dropped like very few requests and the error budget burn was slow. We did fix it in a few days and we saw that the SLI recovered and it came back in before the end of the month.and the point there is that errors, as long as you keep within your SLO errors are acceptable. And that's ultimately the whole point of SLOs. We should allow ourselves to make errors as long as we're within our target. So he was right to one to a degree, but we don't want false alarms. I'm sure you don't either.And we don't wanna have to have arguments and make calls like this one every time an alert fire or every time we're in an incident room. So we took the opportunity to clean up the SLO, cut down on those false alarms. And and once we had done that, we agreed as a team that we would not hesitate to create incidents or indeed update the status page, with better quality alerts.It's easier to do those things. so yeah, the takeaways, SLOs are very powerful. They can also be very painful, I think do use dimensions and do use granularity as much as you can bear. They can help you to keep the subsections of your service really healthy. They can help you to spot issues early before they cascade outwards.They can help you to quickly drill down to root causes. on the other hand. Do exercise restraint, balance those dimensions and, that granularity against the toil and the complexity that it brings. And, yeah, like these things are all available on Grafana Cloud. if you are interested to give it a go, then yeah, please do.That's me. Thank you very much.London 2025 Sessions
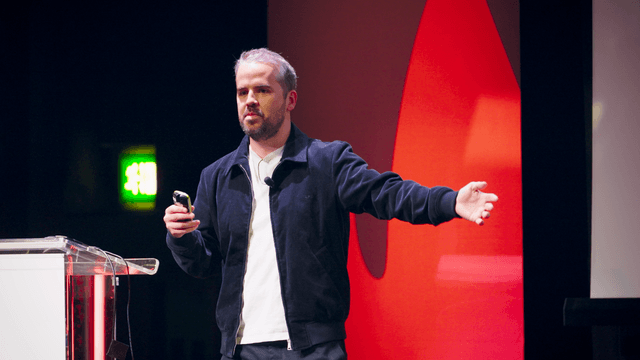
Keynote: Humans, machines, and the future of incident response
 Stephen Whitworth, Co-founder and CEO, incident.io
View session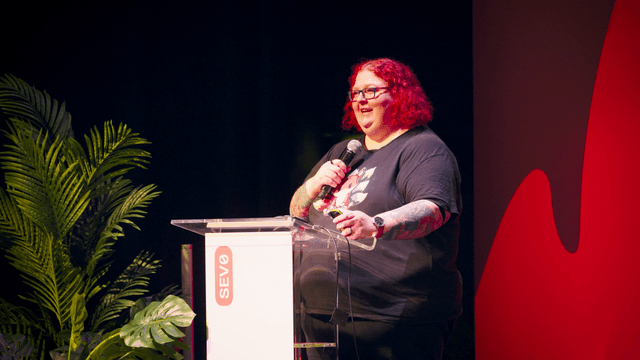
Rethinking growing engineers in the age of AI coding
 Meri Williams, Chief Technology Officer, Pleo
View session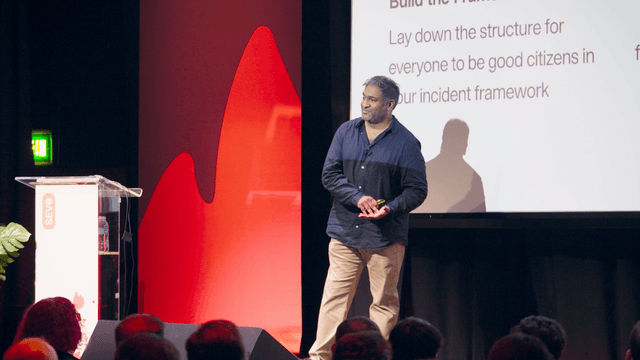
Leading up in a crisis
 Adrian Carvalho, Senior Engineering Manager, Zuari Software
View session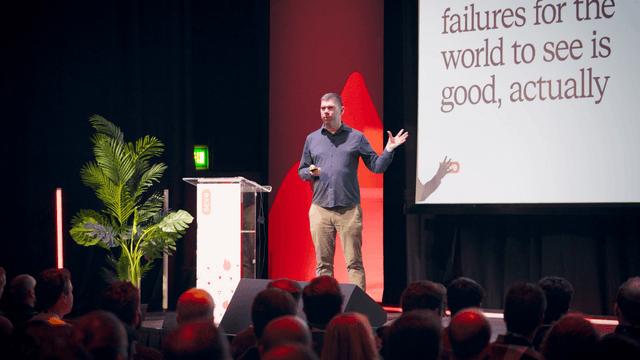
Writing up your most embarrassing failures for the world to see is good, actually
 Brian Scanlan, Senior Principal Engineer, Intercom
View session
Murphy's Law is inevitable. Chaos isn't.
 Katherin Schuppener, Inbound Supply Chain Lead, Picnic
 Luis Almeida Santos, Domain Tech Lead, Picnic
View session
incident.io Product Showcase
 Pete Hamilton, Co-founder and CTO, incident.io
 Lawrence Jones, Principal Engineer, incident.io
 Ed Dean, Product Manager, AI, incident.io
View session
On-call - half baked?
 John Paris, Principal Systems Engineer, Skyscanner
View session
How granular is your SLO?
 Sam Jewell, Staff Software Engineer, Grafana Labs
View session
We should all be declaring more incidents
 Martha Lambert, Product Engineer, incident.io
View session
The day the database disappeared
 Claire Knight, VP Engineering
View session
Maintaining reliability amid layoffs, AI acceleration and acquisitions
 Liam Whelan, Director of Reliability Engineering, Zendesk
View session
